Question 41
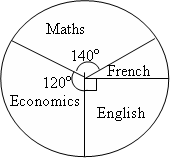
The pie chart above shows the distribution of courses offered by students. What percentages of the students offer English?
The pie chart above shows the distribution of courses offered by students. What percentages of the students offer English?
Find the standard deviation 2, 3, 5 and 6.
Use the table below to answer question
|
Mark |
1 |
2 |
3 |
4 |
5 |
|
Frequencies |
2 |
2 |
8 |
4 |
4 |
Find the mean mark
|
Marks |
2 |
3 |
4 |
5 |
6 |
7 |
8 |
|
No of students |
3 |
1 |
5 |
2 |
4 |
2 |
3 |
From the table above, if the pass mark is 5, how many students failed the test?
What is the mean deviation of x , 2x, x +1, and 3x, if the mean is 2
5, 8, 6 and k occur with frequencies 3, 2, 4 and 1 respectively and have a mean of 5.7. Find the value of k
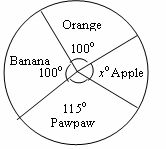
The pie chart above represents 400 fruit in display in a grocery store. How many apples are in the store?
|
No of Days |
1 |
2 |
3 |
4 |
5 |
6 |
|
No of Students |
20 |
2x |
60 |
40 |
x |
50 |