Question 41
|
Mark |
3 |
4 |
5 |
6 |
7 |
8 |
|
Frequency |
5 |
y – 1 |
Y |
|
Mark |
3 |
4 |
5 |
6 |
7 |
8 |
|
Frequency |
5 |
y – 1 |
Y |
If the mean of five consecutive numbers integer is 30. Find the largest of the number
Find the variance 2x, 2x – 1 and 2x + 1

The pie chart above show the expenditure of a family whose income sN30,000, if the expenditure on food is twice that on housing and that school fee is twice that on transport, how much the family spends on food?

The response of 160 pupils in a school asked to indicate their favorite subjects is given in the bar chart above. What percentage of the pupils has English and Health Education as their favorite subjects?
|
Score |
1 |
2 |
3 |
4 |
5 |
6 |
7 |
8 |
|
Frequency |
2 |
3 |
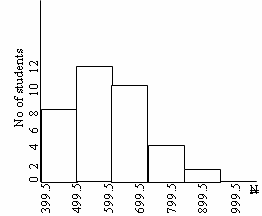
The histogram above shows the distribution of the monthly income of the workers in a company. How many workers earn more than N700.00?
The modal height and range of height
1.35, 1.25, 1.35,. 1.25, 1.40, 1.35, 1.45, 1.50, 1.35, 1.50 and 1.20 are m and r respectively. Find m + 2r
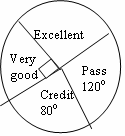
The grade of 36 students in a test shown in the pie chart . How many students had excellent?
Find the value of t if the standard deviation of 2t, 3t, 4t, 5t, and 6t is $\sqrt{2}$