Question 15
Calculate the range 20, –6, 25, 30, 21, 28, 32, 33, 34, 5, 3, 2, and 1
Calculate the range 20, –6, 25, 30, 21, 28, 32, 33, 34, 5, 3, 2, and 1
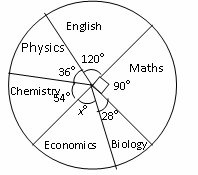 The pie chart above shows the distribution of subjects offered by students in SSSIII level. If 80 students enrolled in the class, what is the size of the angle of the sector in Economics?
If the mean of 4, y, 8 and 10 is 7. Find y
|
Age |
1 |
2 |
3 |
4 |
5 |
6 |
7 |
|
No of Child |
6 |
x |
16 |
2x – 1 |
15 |
12 |
18 |
The distribution above shows the ages of 120 children. Find the value of x
The scores of ten students in a mathematics test with an average score of 10 are 12, 15, 3, 4, 2x, 8, 10, 13, x and 17. Calculate the value of x
The pie chart above shows the sectoral allocation of fruits. Find the allocation of oranges.
Find the median of 5,9,1, 10,3, 8, 9, 9, 2, 4, 5,5, 5,7, 3 and 6

The histogram above shows the number of tons of rice produced. What was the quantity produced from May to September?
The distribution of scores in a class test are as follows: 2,8, 6,5, 8, 6, 6, 5, 6 and 5. Find the product of the modal and median score.
Calculate the standard deviation of 5, 4, 3, 2 and 1