Question 5
The histogram above shows the number of participant in a meeting from Monday to Friday. How many participated on Monday, Wednesday and Thursday?
The histogram above shows the number of participant in a meeting from Monday to Friday. How many participated on Monday, Wednesday and Thursday?
Find the range of 2, 6, 8, 10 25 3, 4, and 32
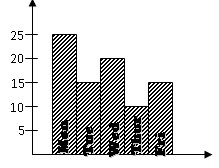
The bar chart above shows the marks obtained by students in a mathematics test
Determine the mean score of the students that took the mathematics test
The bar chart above shows the marks obtained by students in a mathematics test
How many students in all took the test
OGIVE is constructed using
Find the mean of 10, 8, 5, 11, 12, 9, 6, 3, 15, and 23
The mean of 2– t, 4+t, 3 –2t, 2+t and t –1
|
Score |
1 |
6 |
5 |
2 |
|
Frequency |
2 |
3 |
4 |
6 |
From the table above, find the median
|
Marks |
2 |
3 |
4 |
|
Frequency |
4 |
4 |
y |
The table above show the frequency distribution of marks obtained by a group of students. If the total marks is 48, find the value of y
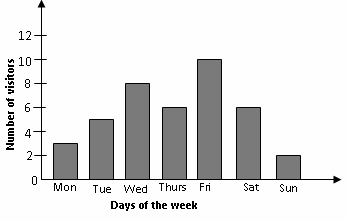
The bar chart above shows the number of visitors received in a week. How many visitors were received on Friday, Tuesday and Sunday?