Jambmaths question:
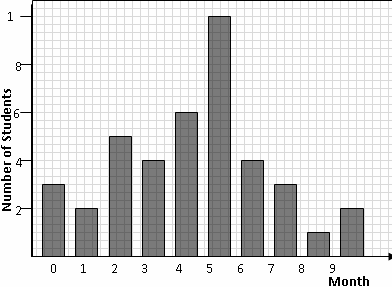
The bar chart above shows the marks obtained by students in a mathematics test
Determine the mean score of the students that took the mathematics test
Option A:
4.5
Option B:
4.3
Option C:
4.2
Option D:
4.6
Jamb Maths Solution:
$\begin{align} & \bar{x}=\frac{\left[ (0\times 3)+(1\times 2)+(2\times 5)+(3\times 4)+(4\times 6)+(5\times 10)+(6\times 4)+(7\times 3)+(8\times 1)+(9\times 2) \right]}{40} \\ & \bar{x}=\frac{171}{40}\approx 4.3 \\\end{align}$
Jamb Maths Topic:
Year of Exam: