Question 20
The marks scored by 30 students in a Mathematics test are recorded in the table below:
|
Scores (Mark) |
0 |
1 |
2 |
3 |
4 |
5 |
|
No of students |
4 |
3 |
7 |
8 |
6 |
2 |
The marks scored by 30 students in a Mathematics test are recorded in the table below:
|
Scores (Mark) |
0 |
1 |
2 |
3 |
4 |
5 |
|
No of students |
4 |
3 |
7 |
8 |
6 |
2 |
Use the table below to answer question 14 and 15
|
Score (x) |
0 |
1 |
2 |
3 |
4 |
5 |
6 |
|
Fre(f) |
5 |
7 |
3 |
7 |
11 |
6 |
7 |
Find the variance
|
Score (x) |
0 |
1 |
2 |
3 |
4 |
5 |
6 |
|
Fre(f) |
5 |
7 |
3 |
7 |
11 |
6 |
7 |
Find the mean of the data
|
Age in years |
7 |
8 |
9 |
10 |
11 |
|
No of pupils |
4 |
13 |
30 |
44 |
9 |
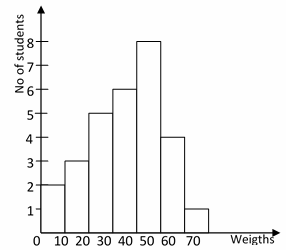 The histogram above represented the weight of students who travelled out of their school for an examination. How many people made the trip.
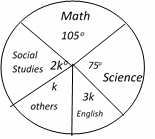 The pie chart above illustrates the amount of private time a student spends in a week studying various subjects. Find the value of k
The variance of 3, 2, 3, 6, 2, 4, 4 and 8 is
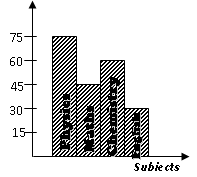
The bar chart above is a representation of a candidate’s scores in UTME in 2014, find his total scores
Find the mean of the distribution
|
X |
21 |
22 |
23 |
24 |
25 |
26 |
36 |
|
F |
3 |
4 |
2 |
6 |
1 |
1 |
3 |
Find the mode of the distribution
|
X |
21 |
22 |
23 |
24 |
25 |
26 |
36 |
|
F |
3 |
4 |
2 |
6 |
1 |
1 |
3 |