Jambmaths question:
The venn diagram below shows the number of students offering Music and History in a class. What is the probability that he offers Music only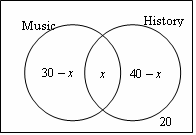
Option A:
0.38
Option B:
0.13
Option C:
0.50
Option D:
0.25
Jamb Maths Solution:
$\begin{align} & \text{Let }M\text{ represent the set of those who offer Music} \\ & \text{Let H represent the set of those who offer History} \\ & n(\xi )=30-x+x+40-x+20 \\ & 80=90-x \\ & x=10 \\ & n(M)=30 \\ & n(H)=40 \\ & n(M\cap H)=10 \\ & n(M\cap {{H}^{1}})=30-10=20\text{ (Those who offer Music only)} \\ & \text{Probability of those offering Music only}=P(M\cap {{H}^{1}}) \\ & P(M\cap {{H}^{1}})=\frac{20}{80}=0.25 \\\end{align}$
Jamb Maths Topic:
Year of Exam: